
Energy consumption comprehensive management system of communication base station based on Ancorui power monitoring instrument
Xu Shuang
 Ankerui Electric Co., Ltd. Jiading 201801
1. Analysis of the status quo of energy consumption of communication base stations
The number of cellular network base stations of communication operators is large, the distribution is wide, installation locations are scattered and the situation is complicated. Most of the base stations are rented houses. Some meters are installed by the grid company. Some meters are installed by the owners. There are many types of meters. There are both inductive and electronic meters as well as IC card meters. Due to the wide range of points and complex situations, communications companies need to send someone or entrust a company to read and maintain meters to meet the day-to-day management of energy consumption such as power calculation and power consumption analysis of base stations. Especially in recent years, with the rapid increase in the number of base stations, the cost of electricity has become the main cost of operators, and the proportion is still increasing year by year. Energy saving and consumption reduction have become one of the company's key tasks. However, the current management of base station power consumption lacks effective means: confusion in power generation management of diesel engines, and analysis of statistical distortions in power consumption information. There is no scientific basis for energy conservation goals.
At present, the following issues are particularly prominent in the energy monitoring and management of communication base stations:
1) The power supply failure cannot be known in time.
Three-phase power supply is used in the base station, and sometimes there are various power supply failures such as phase loss, three-phase unbalance, voltage deviation exceeding the standard, or power outage. The occurrence of these faults will seriously affect the normal operation of the equipment in the base station. If the repair cannot be found in time, it may cause the base station equipment to stop and cause communication failure or even damage the equipment, resulting in serious losses. With manual monitoring, it is impossible to discover the above-mentioned failure in time.
2) Distortion of electricity charges for non-electric power supply base stations.
In addition to the power supply base stations, a large part of the base stations use the power provided by the rental house. Due to the site conditions, many meter installations cannot be standardized, and there are many opportunities for people to make unauthorized changes to the meter or to private power theft. Because there is no advanced technical means to supervise and administer this behavior, we can rely on existing management tools to enable people to change electric meters or steal electricity. Our staff cannot know.
3), artificial power generation duration statistical management confusion.
In the past, data such as the amount of conventional electricity used by each base station, the length of time that a base station was suddenly powered off, and the electricity bills were calculated manually. The biggest drawbacks of the methods were that the method was backward, statistically random, and data inaccurate. With the introduction of the base station maintenance method, the number of generations of power generated by the Daiwei unit to the base station, the start time of power generation, the total duration of artificial power generation, and the tolls and artificial power generation fees paid for the Daiwei unit cannot be verified, resulting in great waste.
4) Privately connected to the base station to steal power
Now all the engine rooms are unattended room, just to the power of stolen electricity. In addition, most people do not have sufficient awareness of the seriousness of the electricity-stealing behavior and believe that theft of electricity is not an illegal crime. Moving money has little to do with this little money. In addition, electricity stealing means are generally more sophisticated, and it is very difficult to catch electric people without using technical means. The use of private wire to steal electricity is quite common. This kind of problem can not truly reflect the actual power consumption of the base station.
5) Lack of systematic statistics on the energy consumption of base stations
Since the time for manual meter reading is not fixed and daily meter reading cannot be performed, it is difficult to establish system power statistics. This lacks an effective basis for mobile companies to choose to save power consumption of base stations, monitor abnormal changes in energy consumption, and test energy efficiency.
6) Inefficient, ineffective, and labor intensive
Because the distribution of base stations is particularly scattered and not concentrated, and they are all distributed on the top floors of buildings, especially in the suburbs, the efficiency of meter reading is extremely low. A meter reader can only copy 15 tables a day, and each meter reader can only record 330 tables a month for 22 days. More than 4,000 base stations require at least 15 meter readers. Under normal circumstances, it is impossible for the monitoring personnel to work at full capacity. Therefore, at least 20 to 25 workers are required.
Even so, each base station can only check once each month, and cannot cope with sudden power failures. In addition to reading the meter, the meter reader is also responsible for checking whether the IC card table has insufficient balance, IC card, whether there is a power theft, whether the power supply is abnormal, and so on. Some of these jobs are very technical and not complete by the average meter reader.
7) The backwardness of power management means leading to an increase in the cost of non-core business management
Because there is no effective scientific management method, mainly relying on manual data collection, operators must invest a large number of personnel to perform power tariff verification and settlement for the base station power supply units or individuals. Mediation of electricity disputes has increased the cost of excessive human resources and management costs in non-core operations.
2. Communication base station seeks comprehensive energy management construction plan
The communication base station energy consumption comprehensive management system platform is a combination of hardware and software, through energy consumption data monitoring and acquisition, quantitative management based on energy efficiency indicators, and analysis and application of three systems. The base station for communication, access points, and module bureaus Energy consumption (including main equipment, power system, air conditioning system, monitoring equipment, supporting systems, etc.) and environmental parameters (humidity, temperature, etc.) in the central computer room are monitored in detail to realize the summarization of energy consumption data. comparison and analysis, the establishment of corporate communications for all types of energy efficiency assessment indicators and management processes, provide the basis for further development of energy-saving measures.
The system monitors the electrical parameters of the communication base station's mains electricity and the power consumption of each branch through the monitoring unit. It can perform statistics, management and analysis on hourly, daily, monthly, and annual time periods for each of the above electricity data, and can present certain data. The electricity consumption data of a time period, a machine room, and a certain type of equipment and the total electricity consumption data of all equipment, and can calculate the base station or equipment electricity benchmark by comparing them with the horizontal information, the same ratio, the ring ratio, and the basic information. Through the intelligent decision analysis system, the base station or equipment with abnormal power usage is notified of maintenance personnel by means of short messages, voice, and work orders in time, and suggestions for rectification are proposed.
3. Application of integrated energy management system for communication base stations in Ulanqab Unicom
3.1 Case Study
Ulan Qab Unicom is part of the China Unicom Network Communications Co., Ltd. Inner Mongolia Branch. It was an ultra-large state-owned telecommunications company established after the merger of China Unicom and China Netcom on October 15, 2008, with fixed assets of 1.3 billion yuan. Under the jurisdiction of ten banner and city branches, more than 2,000 employees, mainly engaged in GSM mobile communications, Internet services, data services, domestic and international fixed telecommunication network facilities and related telecommunications services, with 250,000 GSM mobile phone users, fixed-line , Broadband, PHS and other types of users totaling 350,000.
This project is a comprehensive management system for energy consumption of communication base stations designed for communication base stations of China Unicom's Wulanchabu branch. The status of the communication base station in communication is very important. The communication signal is mainly transmitted through the base station. The base station transmits the signal received from the mobile phone to the server. After the server processes and sends it to the base station, the base station then sends it to the target mobile phone, completing a communication. Without a base station, communication cannot be completed, as is the case with fixed telephones. This system is to monitor the power supply system of the communication base station to ensure its normal power supply, so that the communication base station will not affect the operation due to the failure of the power supply system, and the management personnel can not get the fault information in time.
3.2, software design reference standards and basis
GB/50198-94 Â "Monitoring System Engineering Technical Specifications"
GB/T13730 Â "Regional Power Grid Data Acquisition and Monitoring System General Technical Conditions"
DL/T630 Â "AC sampling remote control terminal general technical conditions"
GB/T13729 Â "Remote Acting Terminal General Technical Conditions"
GB2887 Â "Technical Requirements for Computing Station Sites"
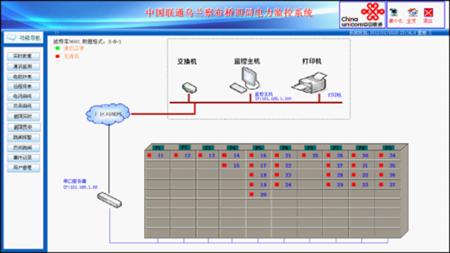
3.3, system architecture
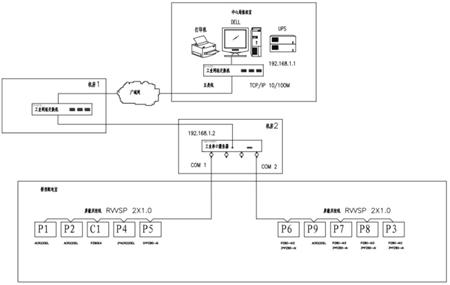
Communication network: Communication network integration includes the connection of field devices and the formation of communication networks. The connection between on-site smart meters, each meter through the shielded twisted pair, and the transmission and access dynamic ring monitoring system in the form of fieldbus; due to the wide distribution of base stations in China Unicom, the distance between the base station and the station is very far to several kilometers Level, we can consider the application of fiber to network transmission.
Communication equipment: It is mainly composed of communication manager, Ethernet equipment and bus network. This layer is a bridge for data information exchange. It is responsible for the collection, classification, and transmission of data information sent back by field devices, and it also conveys various control commands from the upper computer to the field devices.
Communication Manager: It is a system data processing and intelligent communication management center. It has data acquisition and processing, communication controllers, front-end machines and other functions. Ethernet devices: Includes industrial-grade Ethernet switches.
Communication medium: The system mainly uses shielded twisted pair, optical fiber and wireless communication.
Unicom monitoring platform shall monitor and query the energy consumption data of each base station through the main station, perform background statistical analysis on the energy consumption data obtained by the station energy management server from the base station monitoring center, and preprocess the data generated by the energy management report. In order to construct an integrated network energy management system, the basic information of the station is stored in the energy management system database; statistical analysis of the energy consumption summary data, energy consumption year-on-year data, energy consumption ring data, and unit energy Consumption analysis data, energy efficiency data, etc.
3.4, device parameter list
No.
name
Model, specification
unit
Quantity
1
Field device layer
Power Meter
 
only
27
2
Station control management
 
Workstation host
EVOC IPC-810B Core2 2.66G / 1G/250G + keyboard and mouse
station
1
monitor
19W "LCD Monitor
station
1
UPS power supply
C1K/1KVA
station
1
printer
HP 1007 A4 format
station
1
Console
Steel wood structure with a chair
set
1
Energy Analysis Software
System Configuration Software Acrel-5000
set
1
Energy Analysis Software
Data Storage Software Acrel-dbSQL
set
1
Energy Analysis Software
Power Monitoring Software Acrel-EnerSys
set
1
Energy Analysis Software
Device Driver Software Acrel-Driver
set
1
3
Network communication layer
 
Industrial Serial Server
JetPort5604i RS485 interface × 4
set
1
3.5, system design parameters
Telemetry accuracy rate:
≥99.9%
Analog measurement error:
<0.5%
Telemetry update period:
15min (minimum resolution 1min adjustable)
Call screen response time:
<2S
Accident push screen time:
<2S
Network rate:
10M/100M
Working environment temperature range:
-20 °C ~+55 °C
Relative temperature:
≤95% (25 °C )
Historical curve daily, monthly report storage time
≥1 year
System service life:
≥5 years
MTBF: MTBF:
≥30000 hours
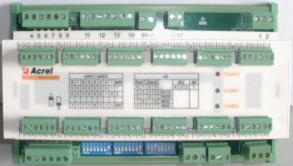
3.6. Kinds of Power Meters Can be Installed on the Field Device Layer
Take a certain distribution box as an example, as shown in the following figure: The distance between the incoming line of the utility power and the oil machine and the distribution cabinet at the outlet is far away, and the instrument DTSD1352 is equipped at A0 and the current transformer is installed (in view of the renovation project) It is recommended to use open transformers. A1 to A5 are equipped with AMC16MA and current transformers are installed; B0 to B12 are equipped with AMC16MD meters and Hall sensors are installed.
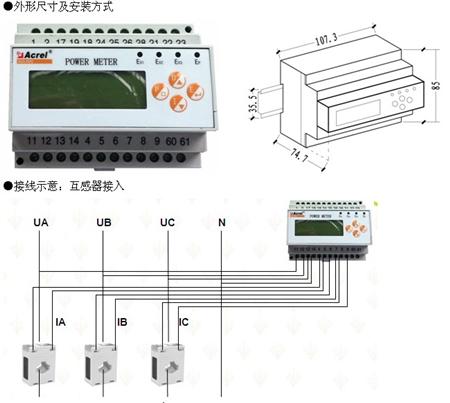

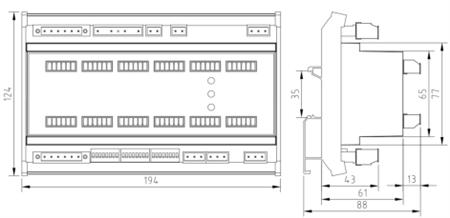
â—Dimensions and installation methods
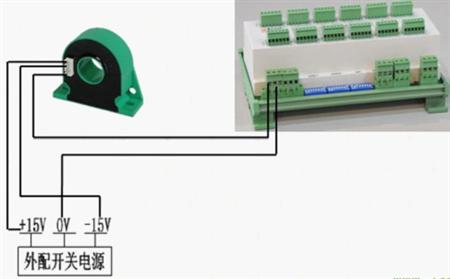
â— Current loop connection
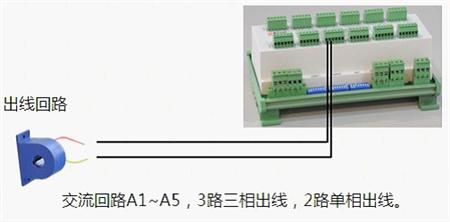
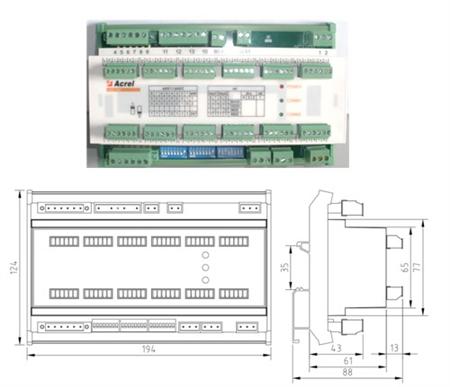
3.6.3 AMC16MD DC Multi-meter Energy Meter
â—Function
Ø Measuring DC power
Ø Measuring DC bus U, 42 DC outlets I, P
Ø 1 channel RS485 communication
â—Dimensions and installation methods
â— Current loop connection
3.7, system function
3.7.1 Data Acquisition and Processing
Data acquisition is the basis of power distribution monitoring. Data acquisition is mainly accomplished by on-site measurement and control layer instrumentation to achieve local real-time display of remote data. The signals that need to be collected include: three-phase voltage U, three-phase current I, frequency Hz, power P, power factor COS φ, power EPI, and remote device operating status.
3.7.2 Database Establishment and Query
It mainly completes remote measurement and remote signal acquisition, and establishes a database. The collected real-time data is stored in the database at regular intervals for customers to query according to their own time.
3.7.3 Historical data and real-time data output
When the customer queries the data, they can choose to export the report as an excel document or print it directly for archiving.
The back-office IPC completes the data collection of the power parameters of the loops through the transmission channels provided by the field devices and communication systems . The information is analyzed and processed, and the forms are used for reference by the operators in various forms such as reports, so that the on-duty personnel can easily grasp the power supply system. The health of the equipment, including its operating conditions .
3.7.4 Collection of Operation Information and Protection Information
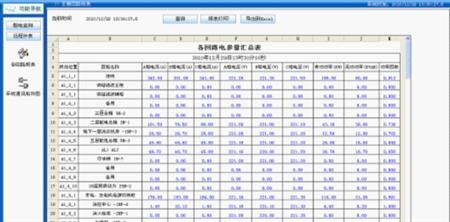
The system collects the parameters sent from the intelligent measurement and control unit devices, and the low-voltage main incoming line , bus-coupled and outgoing telemetry signals. Including voltage, current, active power, reactive power, power factor, frequency, active energy, reactive energy, and various alarm information, etc. of each loop.
3.7.5 man-machine interface
The system provides simple, easy to use, and good user interface. According to the distribution system, the equipment status of the distribution system and the corresponding real-time operating parameters can be displayed.
The system software provides full-featured graphics editing software. The user can customize the display mode of various graphics and devices in various states according to the actual situation and past habits.
Includes the following features:
The graphical screen edited by the full graphic mode has a variety of display characteristics, and the user can edit, locate, and view related information and content very intuitively and conveniently.
Provides a screen management tool that can associate relevant calls, quick call of important screens, screen file index selection, and automatic accident recall screen.
Provide a variety of numerical display means, the value can be displayed with a bar graph, curve display, and according to the user's needs and habits according to the status and status of the system to define flashing, discoloration and special symbols to distinguish between various data including telemetry The normal, higher limit, lower limit, etc.
Screen display: Chinese liquid crystal display, optional graphical color, flashing, animation and other means to fully represent the working condition diagram and operation screen, utility parameter table of the power distribution system, various types of operation ticket and report, accident and fault alarm display, measurement and control and protection unit Operation status display and other power running status; the screen shows response time 1s.
3.7.6 Statistical Analysis, Reporting, Printing
Database real-time and historical records are retained for more than 3 years;
Conduct summary statistics on various electrical equipment and system operating parameters, and generate various types of reports based on user requirements, including:
n Time-sharing, daily, monthly, quarterly and annual reports;
n various equipment parameters and the most value statistical reports;
n the whole system to run statistical reports and so on;
n For event recording, alarm and data reports, can be set to timed printing ;
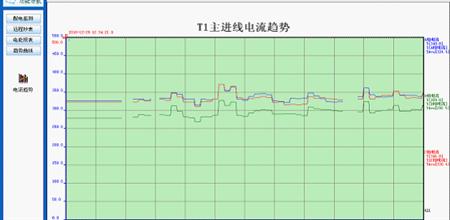
3.7.7 Historical Records and Trend Analysis
The system collects real-time data of each monitoring control and management device and stores it in an open database. The system can store long-term (years) history records. According to historical data records, annual, monthly and daily changes of various parameters and real-time data trend analysis can be carried out, and classification and comprehensive comparison and analysis can be carried out to provide basis for optimization of business processes and optimization of equipment and facility usage.
trend analysis:
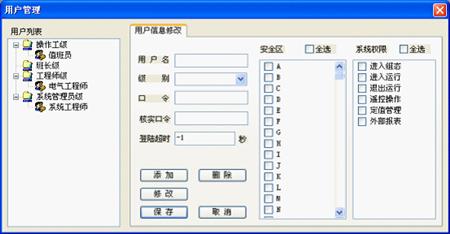
3.7.8 System Security
The system software sets up as many as hundreds of password partitions and secret level settings. It provides passwords for system administrators, engineers, value-changers, general duty operators, etc., and automatically records all operations with time-stamp events. Anti-accident measures.
User rights management:
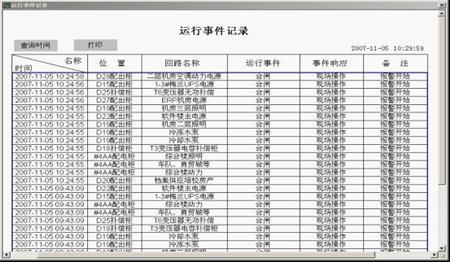
3.7.9 Failure Analysis and Equipment Maintenance Management
The system can analyze the causes of faults and events based on event records and waveform records with time stamps. In addition, the status parameters and cumulative life parameters of the system's statistical switch and other equipment can provide advance notice of equipment maintenance.
record:
3.7.10 Other functions
Other day-to-day management, such as operation records and shift record management, equipment operation status, defects, maintenance records management, rules and regulations. Management functions meet user requirements, application, convenience, and resource sharing. Various documents can be stored, retrieved, edited, displayed, and printed.
4, summary
For China Unicom, the base station needs to implement fine energy management. With the current status, it requires a lot of manpower, material resources and financial resources. Because of the large number and scattered geographical location, it has caused great inconvenience to the staff. The Acrel-5000 integrated energy management system is used for monitoring , and the related data is automatically read and analyzed, and further remote control or equipment maintenance can be performed, which can reduce human resources, shorten repair time, and save special line construction costs.
ã€references】
[ 1 ] Ren Chengcheng and Zhou Zhong, The Principles and Application Guide for Digital Meters for Electric Power Measurement China Electric Power Press 2007.4
[2] Zhu Liquan Analysis of Intelligent Management System of Power Distribution System Intelligent Building Electrical Technology, Vol. 1, No. 4, 2007
[ 3 ] Ankerui Electric Co., Ltd. Product Manual. 2013.01.
About the Author:
Xu Shuang, female, undergraduate, Ankerui Electric Co., Ltd., the main research direction for the smart grid power distribution, Email: Mobile QQ
"Atlas of Design and Application of Building Energy Consumption Monitoring and Management System" (atlas number: ACR12CDX301) edited by Ankerui Electric Co., Ltd. and Shandong Construction Electrical Technology Information Network, this atlas combined with Acrel-5000 energy consumption The monitoring system complies with the electrical design specifications and meets the requirements for the construction of energy-saving supervision systems for office buildings and public buildings of state agencies, to achieve the scientific and data-based management of green building energy use, and to achieve the goal of saving energy and reducing consumption of green buildings. The Atlas is applicable to the system design, construction, operation and maintenance of energy monitoring and management of office buildings and public buildings of newly-built or rebuilt national offices. If you need atlas, please provide your organization's name, department, address, zip code, contact person, contact telephone number, email address, fax 021-69155331, mail or QQ to Ankeru Xu cream engineer, Ankerui Electric will give you a free gift. .
1. Introduction
Flatbed Truck is also called platform truck,construction machinery transport truck, excavator transport truck, and harvester carrier. Platform truck is a common large vehicle for carry big machine.
2. Application
Flatbed truck is widely used for transporting machinery like excavators, loaders, harvesters and any other non-removable objects. Platform truck is generally widely used on road, factories, construction sites and other large-scale location of production. our platform trucks have strong loading capacity. Loading capacity ranges from 5tons to 30tons.
Our platform truck can be equipped with a crane to load or unload, platform can extand wider and narrowly, especially for the wild lifting at railway stations, wharfs, warehouses, construction sites and other narrowly working places.
Flatbed Truck
Flatbed Truck,Flatbed Semi Trailer,Roller Bed Trailers,Hydraulic Bed Trailer
Suizhou lishen special vehicle co.,ltd , http://www.ls-truck.com